2D Grafika
1 Úvod
| (%i1) | f(x):=exp(-x^2)*sin(%pi*x^3); |

| (%i2) | wxplot2d(f(x), [x, -2,2]); |
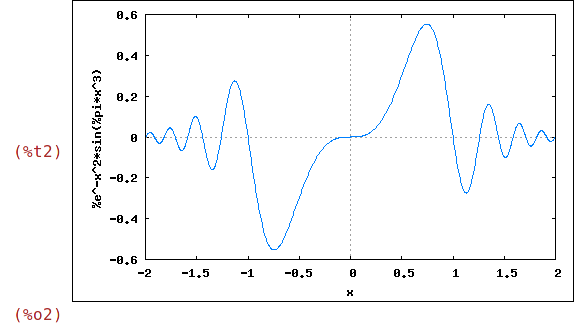
| (%i3) | plot2d(f(x), [x, -2,2], [plot_format,mgnuplot]); |

| (%i4) | plot2d(f(x), [x, -2,2], [plot_format,openmath]); |

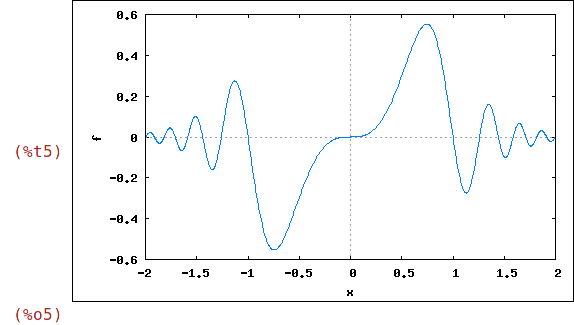
| (%i5) | wxplot2d(f, [x,-2,2]); |
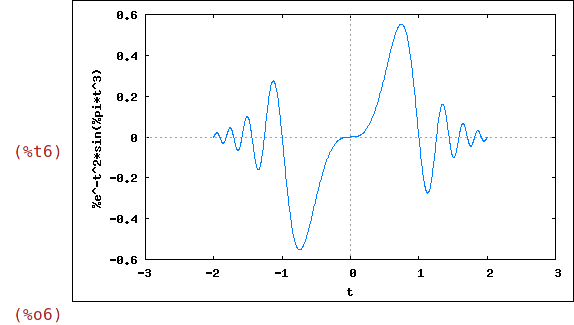
| (%i6) | wxplot2d(f(t), [t,-2,2],[x,-3,3]); |
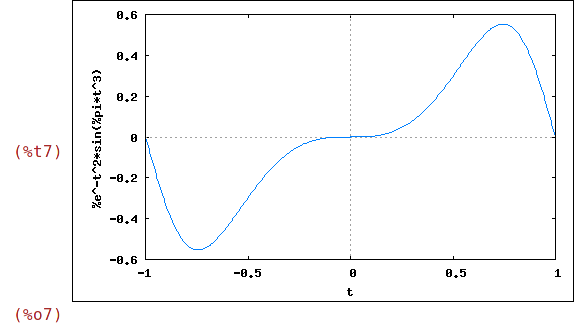
| (%i7) | wxplot2d(f(t), [t,-2,2],[x,-1,1]); |
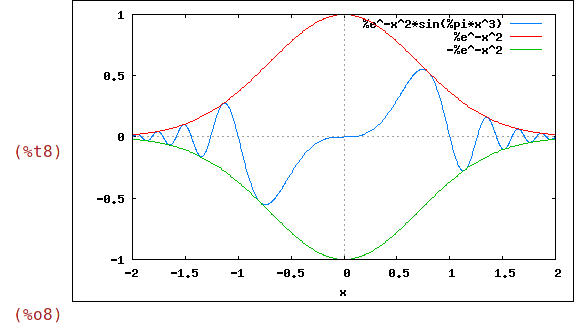
| (%i8) | wxplot2d([f(x), exp(-x^2), -exp(-x^2)], [x,-2,2]); |
| (%i9) | wxplot2d([sin(x)/x,cos(x)], [x,0,2*%pi], [style, [lines,1,1], [lines,4,2]]); |
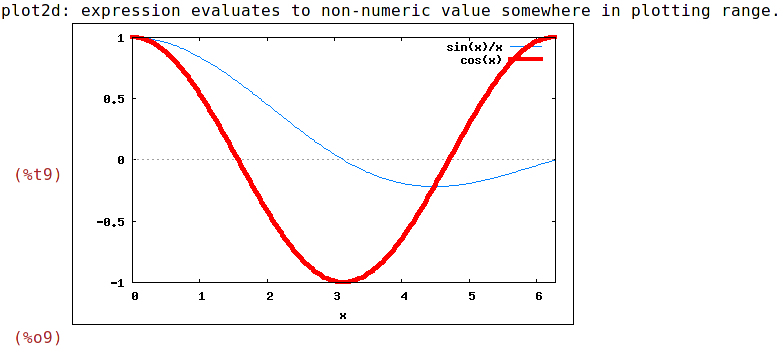
[lines,1,1] - první z čísel udává tloušťku čáry a druhé barvu:
1: blue, 2: red, 3: magenta, 4: orange, 5: brown, 6: lime a 7: aqua
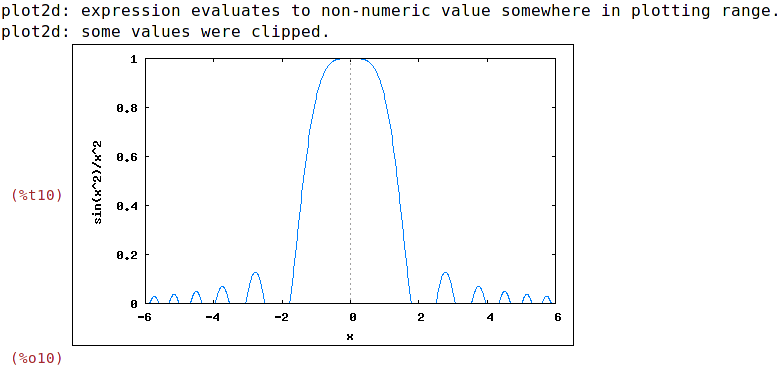
| (%i10) | wxplot2d([sin(x^2)/x^2], [x,-6,6], [y,0,1]); |
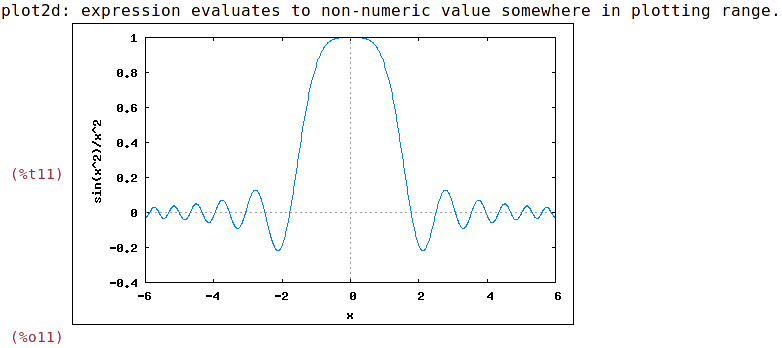
| (%i11) | wxplot2d([sin(x^2)/x^2], [x,-6,6]); |
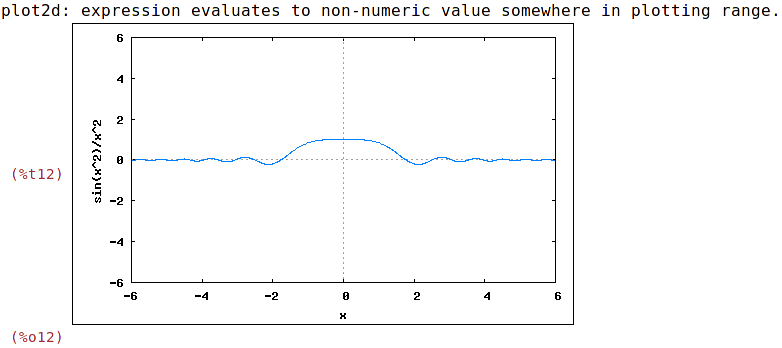
| (%i12) | wxplot2d([sin(x^2)/x^2], [x,-6,6], [y,-6,6]); |
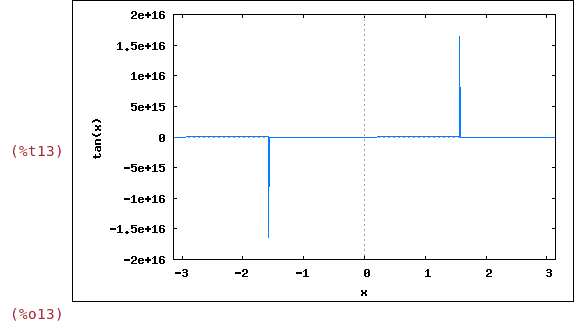
| (%i13) | wxplot2d(tan(x), [x,-%pi,%pi]); |
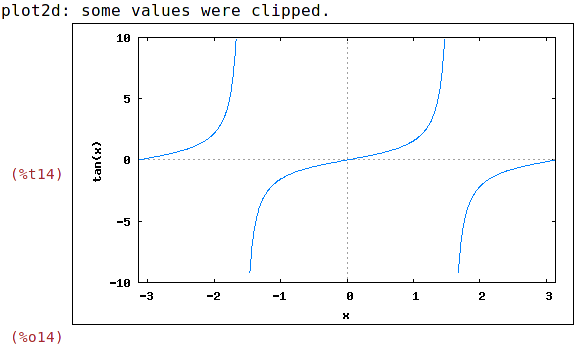
| (%i14) | wxplot2d(tan(x), [x,-%pi,%pi],[y,-10,10]); |
| (%i15) |
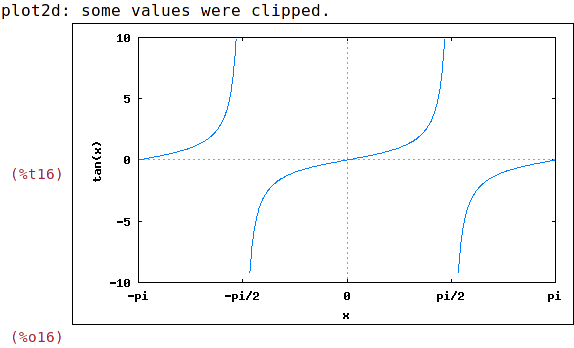
my_preamble: "set xtics ('-pi' -3.1415, '-pi/2' -1.5708, '0' 0, \ 'pi/2' 1.5708, 'pi' 3.1415)"$ |
Tento řetězec musí být zadán bez řádkových zlomů.
| (%i16) |
wxplot2d(tan(x), [x, -%pi, 1*%pi], [y, -10, 10], [axes, x], [gnuplot_preamble, my_preamble]); |
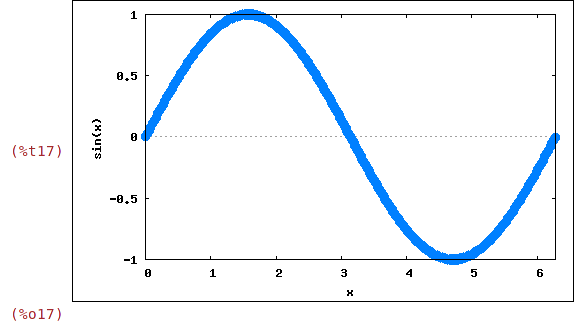
| (%i17) | wxplot2d(sin(x), [x,0,2*%pi], [style,points]); |
| (%i18) | xx:[10, 20, 30, 40, 50]$ |
| (%i19) | yy:[.6, .9, 1.1, 1.3, 1.4]$ |
| (%i20) | xy:[[10,.6], [20,.9], [30,1.1], [40,1.3], [50,1.4]]$ |
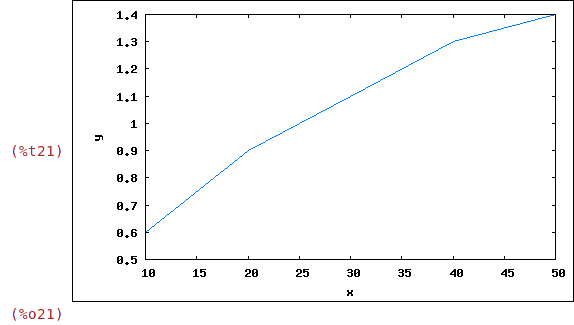
| (%i21) | wxplot2d([discrete,xx,yy]); |
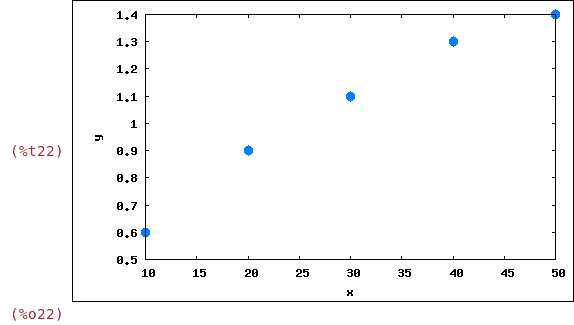
| (%i22) | wxplot2d([discrete,xx,yy], [style, points]); |
| (%i23) | wxplot2d([discrete, xy], [style, [points,5,2,6]]); |
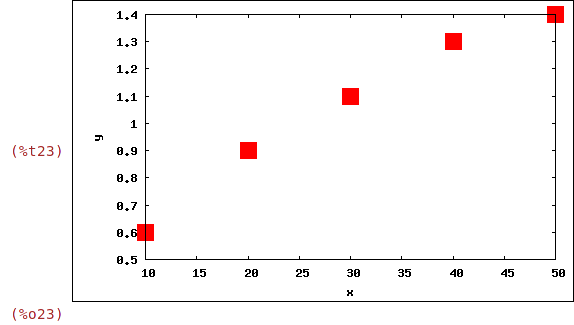
Volba points může mít dva nebo tři parametry, první parametr určuje poloměr zvoleného objektu,
druhý parametr (celé číslo) určuje barvu (stejně jako u volby lines) a třetí parametr je využíván pouze při zobrazení
pomocí Gnuplotu a určuje objekt pro zobrazení bodu.
Typy objektů: 1: filled circles, 2: open circles, 3: plus signs, 4: x, 5: *, 6: filled squares, 7: open squares,
8: filled triangles, 9: open triangles, 10: filled inverted triangles, 11: open inverted triangles,
12: filled lozenges and 13: open lozenges.
Volba linesdots akceptuje až čtyři parametry: tloušťku čáry, poloměr bodu, barvu a typ objektu.
Implicitní hodnoty všech voleb
| (%i24) | plot_options; |

Nastavení provádíme buď lokálně příkazem plot2d nebo globálně příkazem set_plot_option.
| (%i25) | f(x):=sqrt(2)-sqrt(2*sqrt(x))$ |
| (%i26) | wxplot2d(f(x), [x,0,1], [y,0,sqrt(2)]); |
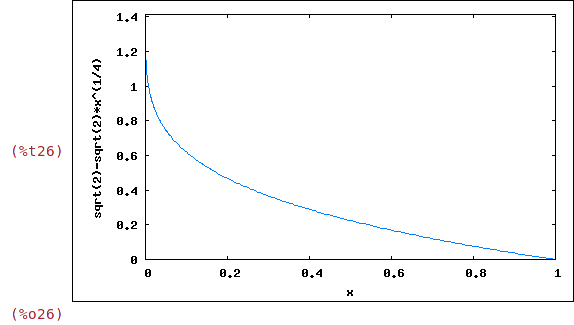
| (%i27) | wxplot2d(f(x), [x,0,0.01], [y,1,sqrt(2)]); |
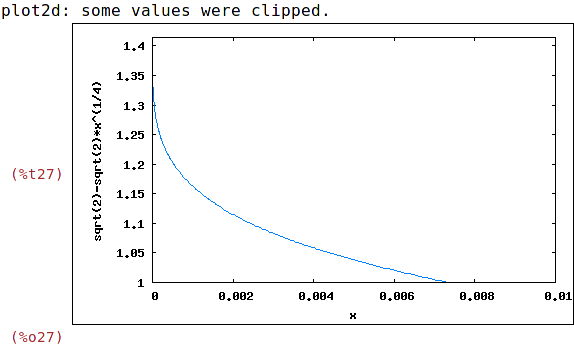
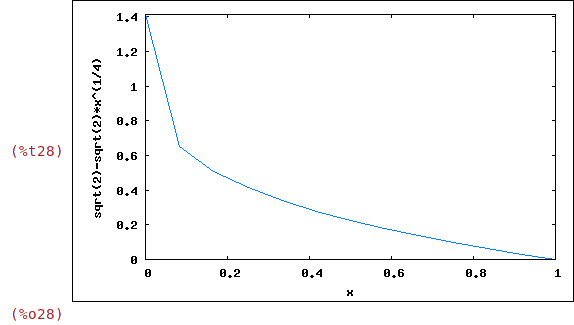
| (%i28) | wxplot2d(f(x), [x,0,1], [y,0,sqrt(2)], [nticks, 3], [adapt_depth, 0]); |
| (%i29) | wxplot2d(f(x), [x,0,1], [y,0,sqrt(2)], [nticks, 3]); |
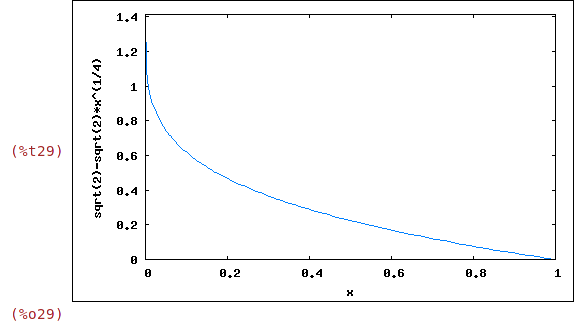
Implicitní hodnoty jsou pro nticks 29 a pro adapt_depth 10.
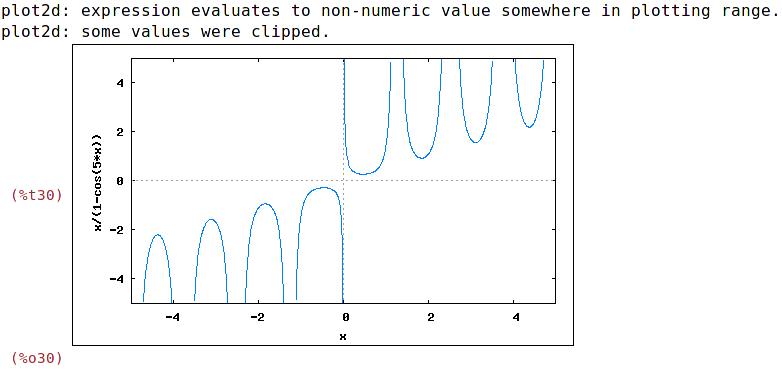
| (%i30) | wxplot2d(x/(1-cos(5*x)), [x,-5,5], [y,-5,5]); |
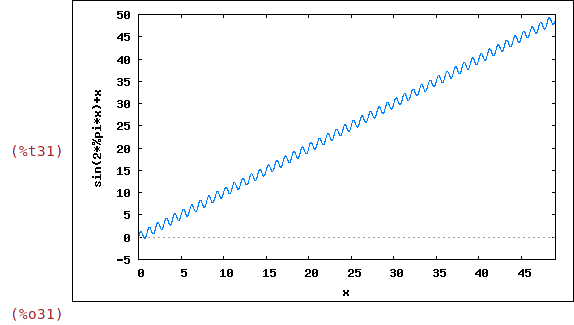
| (%i31) | wxplot2d(x+sin(2*%pi*x), [x,0,49]); |
2 Speciální dvojdimensionální obrázky
Krivka daná parametricky
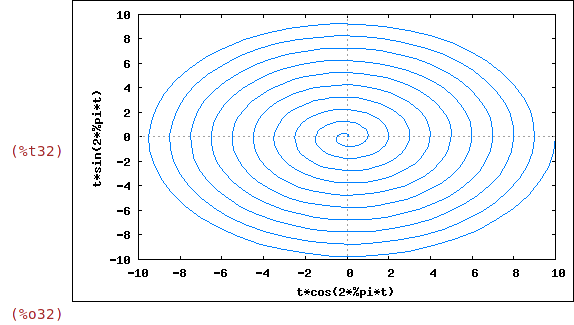
| (%i32) | wxplot2d([parametric, t*cos(2*%pi*t), t*sin(2*%pi*t), [t,0,10]], [nticks,500]); |
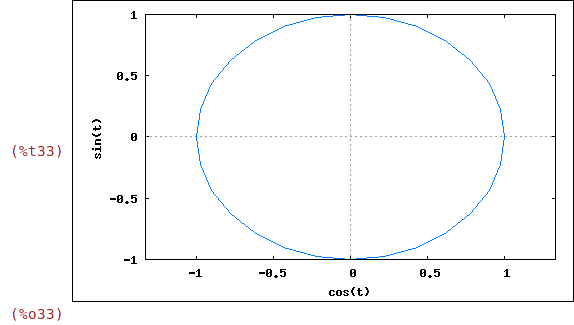
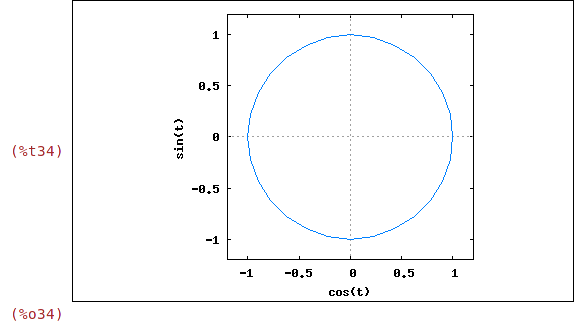
| (%i33) | wxplot2d([parametric, cos(t), sin(t), [t,-%pi,%pi]],[x,-4/3,4/3]); |
| (%i34) |
wxplot2d([parametric, cos(t), sin(t), [t,-%pi,%pi]],[x,-1.2,1.2], [y,-1.2,1.2], [gnuplot_preamble, "set size ratio 1;"]); |
| (%i35) | kill(all); |

Grafické možnosti Maximy výrazně rozšiřuje balíček draw. Ke správné činnosti vyžaduje instalaci Gnuplotu
alepoň ve verzi 4.2.
| (%i1) | load(draw); |

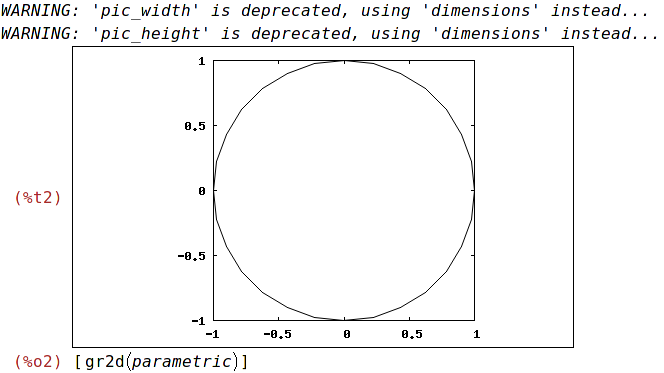
| (%i2) | wxdraw2d(parametric(cos(t),sin(t),t,0,2*%pi),proportional_axes=xy); |
Křivka v polárních souřadnicích
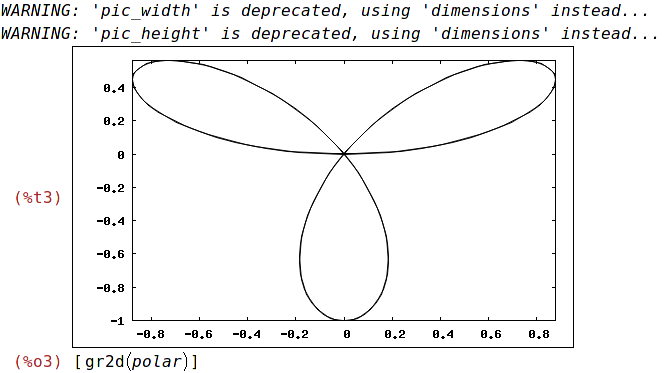
| (%i3) | wxdraw2d(nticks=200,polar(sin(3*theta),theta,0,2*%pi)); |
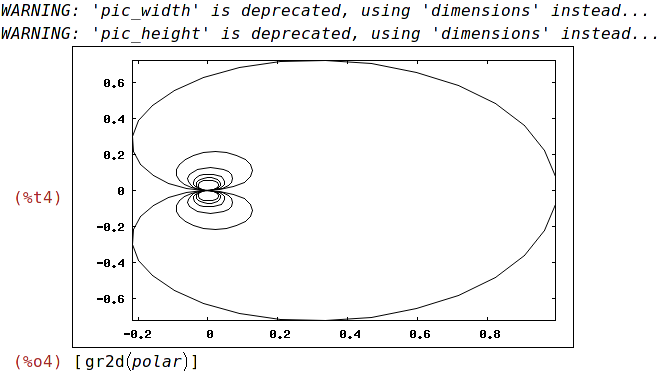
| (%i4) | wxdraw2d(nticks=250,polar(sin(t)/t,t,-6*%pi,6*%pi)); |
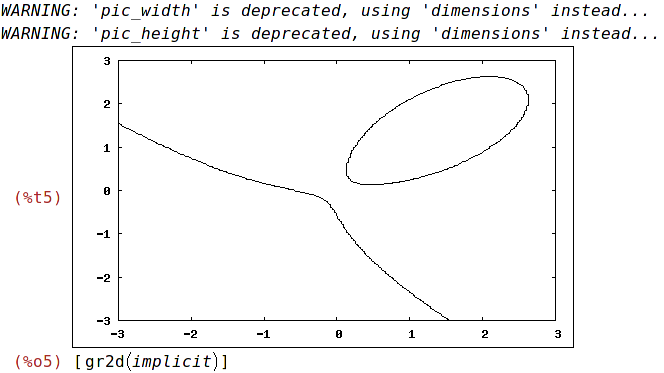
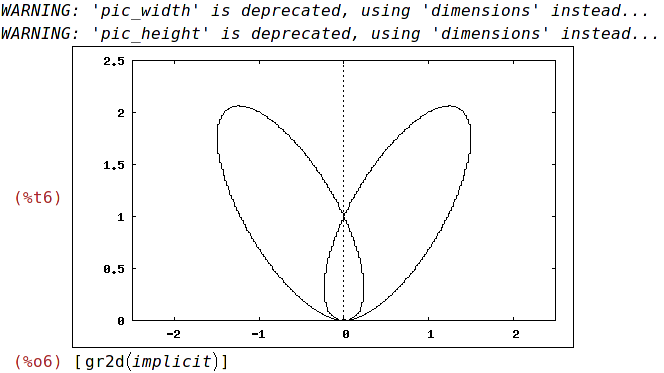
Křivka daná implicitně
| (%i5) | wxdraw2d(implicit(x^3+y^3-5*x*y+1/5=0, x,-3,3, y,-3,3)); |
| (%i6) |
wxdraw2d(xaxis=true, yaxis=true, implicit(2*x^4+y^4-3*x^2*y-2*y^3+y^2, x,-5/2,5/2, y,0,5/2)); |
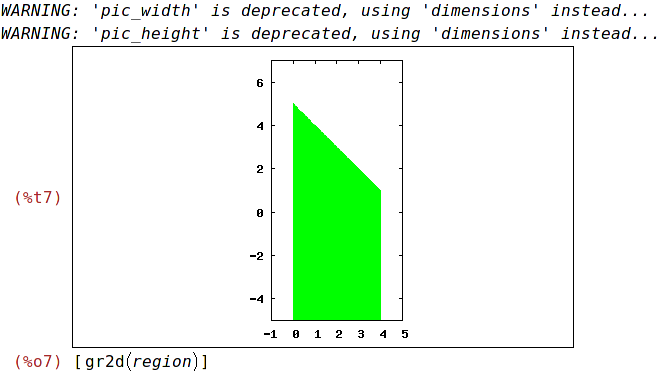
Následující obrázek ukazuje oblast vyhovující nerovnicím
| (%i7) |
wxdraw2d( x_voxel = 60, y_voxel = 60, proportional_axes=xy, fill_color = green, region(x+y<5 and 0 |
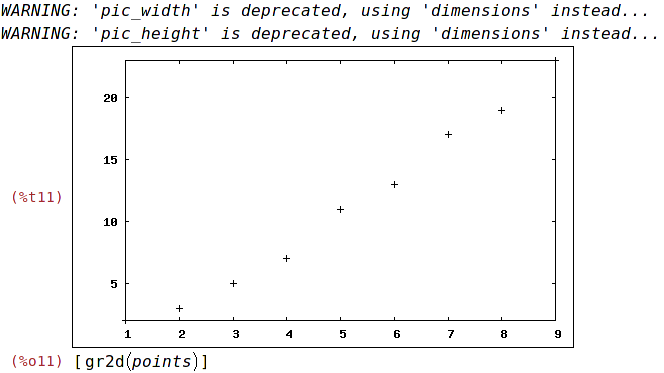
Prokládání křivek
| (%i8) | xx:[1,2,3,4,5,6,7,8,9]; |

| (%i9) | xx:makelist(i,i,1,9); |

| (%i10) | yy:[2,3,5,7,11,13,17,19,23]; |

| (%i11) | wxdraw2d(points(xx,yy)); |
| (%i12) | dataL:[[1,2],[2,3],[3,5],[4,7],[5,11],[6,13],[7,17],[8,19],[9,23]]; |

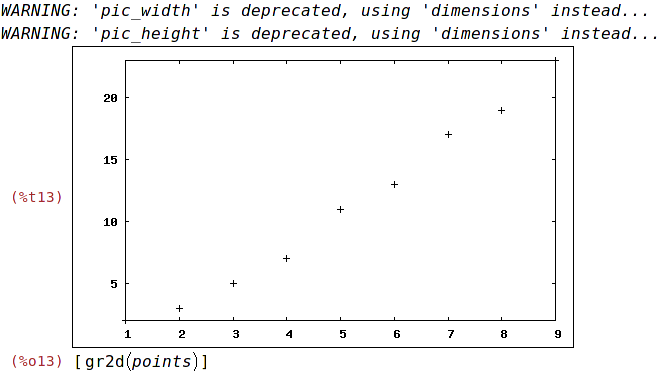
| (%i13) | wxdraw2d(points(dataL)); |
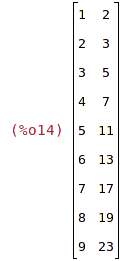
| (%i14) | dataM : apply ('matrix, dataL); |
| (%i15) | load(lsquares); |

| (%i16) | fprintprec:8; |

| (%i17) | lsquares_estimates (dataM, [x,y], y=a*x+b, [a,b]); |

| (%i18) | fit: a*x+b, %; |

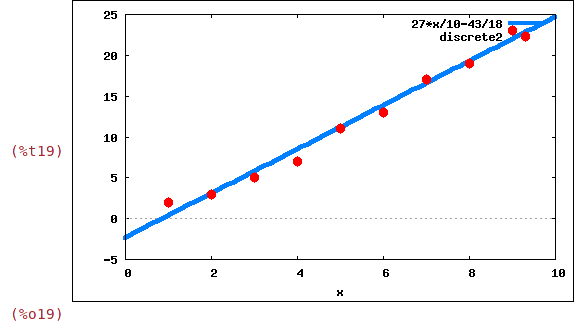
| (%i19) | wxplot2d ([fit, [discrete, dataL]], [x,0,10], [style,[lines,4],[points,3,2,1]]); |
| (%i20) |
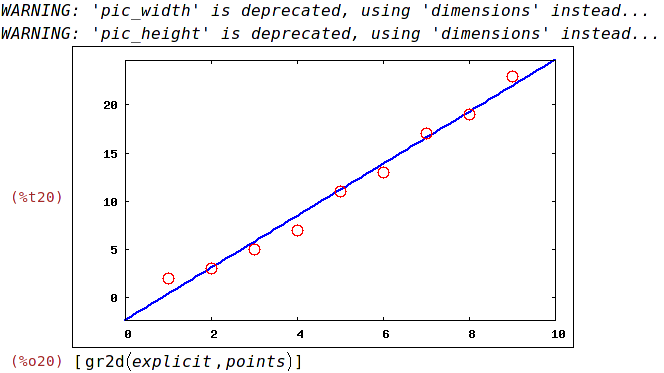
wxdraw2d(line_width=2, color=blue, explicit(fit, x,0,10), color=red, point_type=6, point_size=2, points(dataL)); |
3 Ukládání grafiky
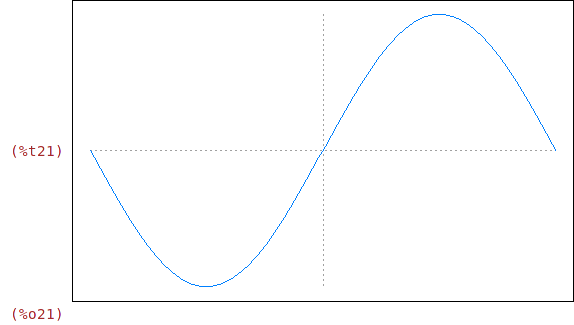
| (%i21) | wxplot2d(sin(x), [x,-%pi,%pi], [box, false]); |
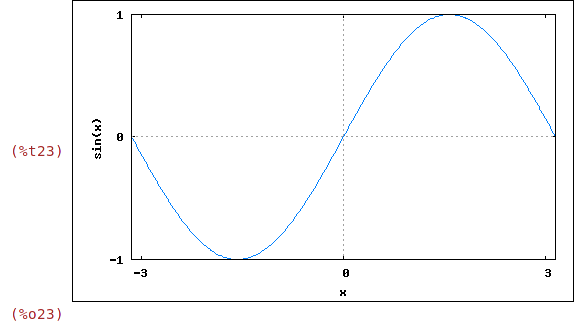
| (%i22) | preamble: "set xtics(-3,0,3); set ytics(-1,0,1)"$ |
| (%i23) | wxplot2d(sin(x), [x,-%pi,%pi], [gnuplot_preamble, preamble]); |
| (%i24) | plot2d(sin(x), [x,-%pi,%pi], [psfile, "sin_maxima.eps"]); |

| (%i25) |
plot2d(sin(x), [x,-%pi,%pi], [gnuplot_term,ps], [gnuplot_out_file,"sin_maxima2.eps"]); |

| (%i26) | draw2d(explicit(sin(x),x,-%pi,%pi), terminal=eps_color); |

| (%i27) | draw2d(explicit(sin(x),x,-%pi,%pi), terminal=svg); |
